Frequency Visualizer
A real-time waveform renderer: nine signal shapes (sine, square, triangle, sawtooth, pulse, noise, and more) drawn live, each with adjustable amplitude, period, sampling, and colour. Built on my own C++ application framework.
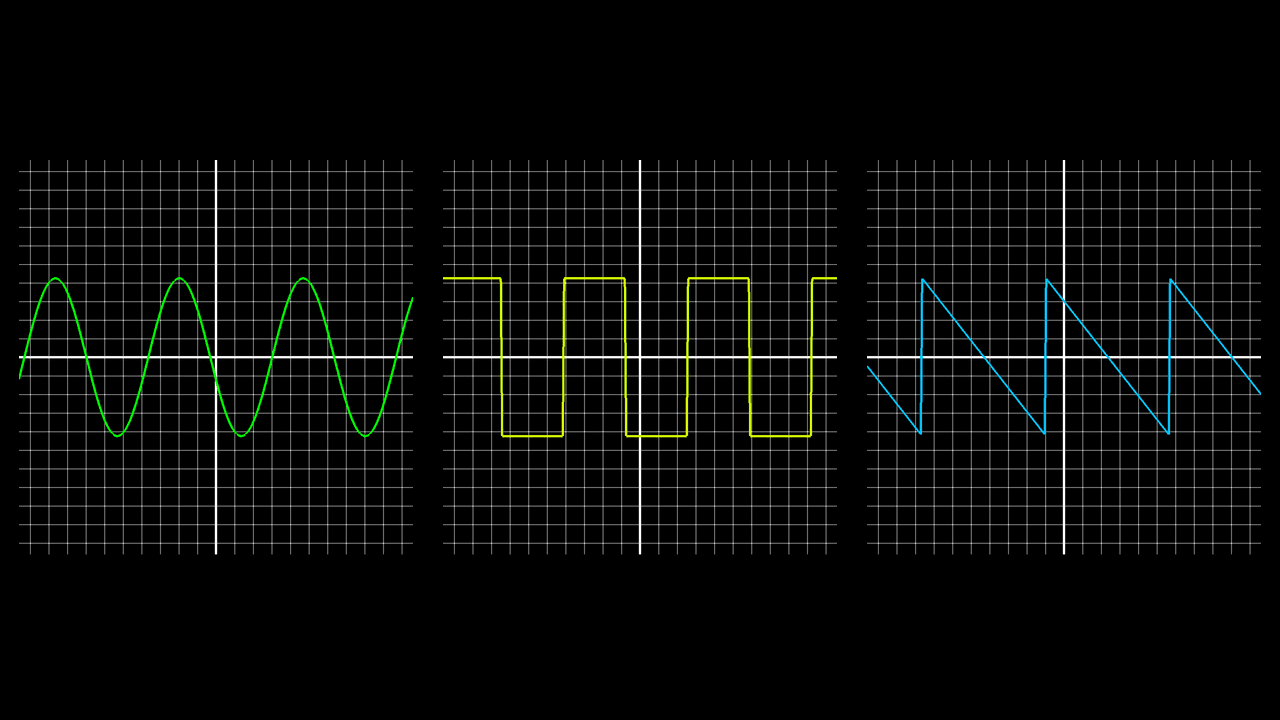
Frequency Visualizer is a small real-time tool for drawing and playing with signal shapes. It came out of two things at once: I like signals and waveforms, and I wanted another focused piece to build on my own C++ application framework. The appeal is immediacy, move a slider and the wave redraws under your hand.
What it does
Nine waveform types, all rendered live:
- Sine and absolute sine
- Cosine
- Square
- Triangle
- Sawtooth
- Pulse, with duty-cycle control
- Noise
- Exponential decay
Each is driven by parameters you adjust on the fly: amplitude, speed, period, line thickness, sample count, and colour, plus a waveform inversion toggle. Nothing waits for a re-render, so the effect of every parameter is visible the instant you touch it.
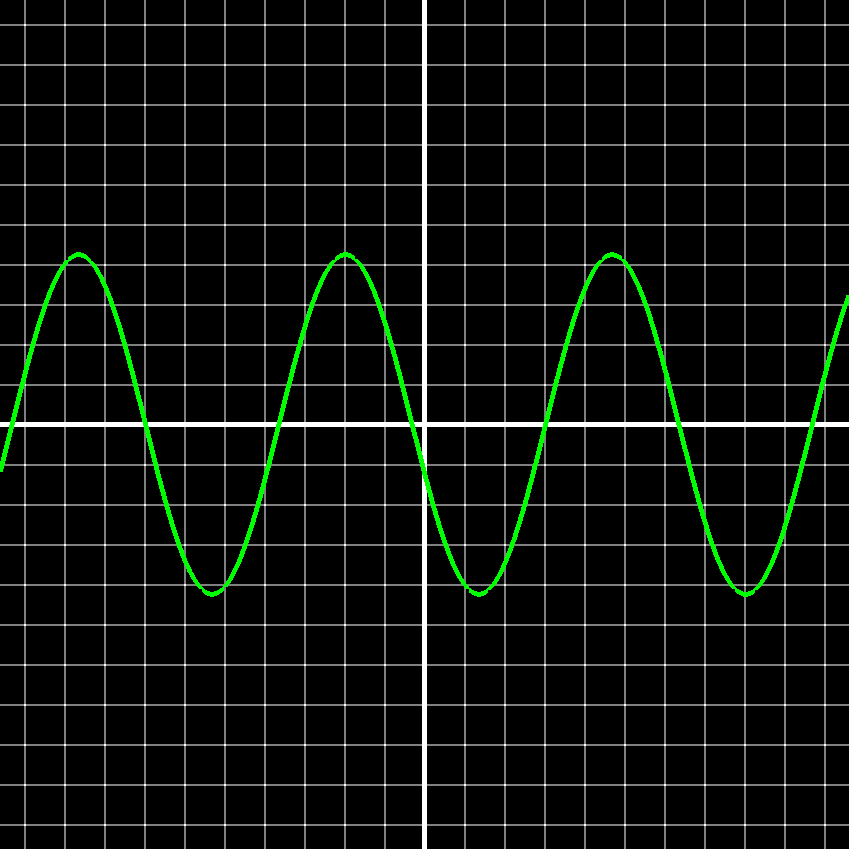 Sine
Sine
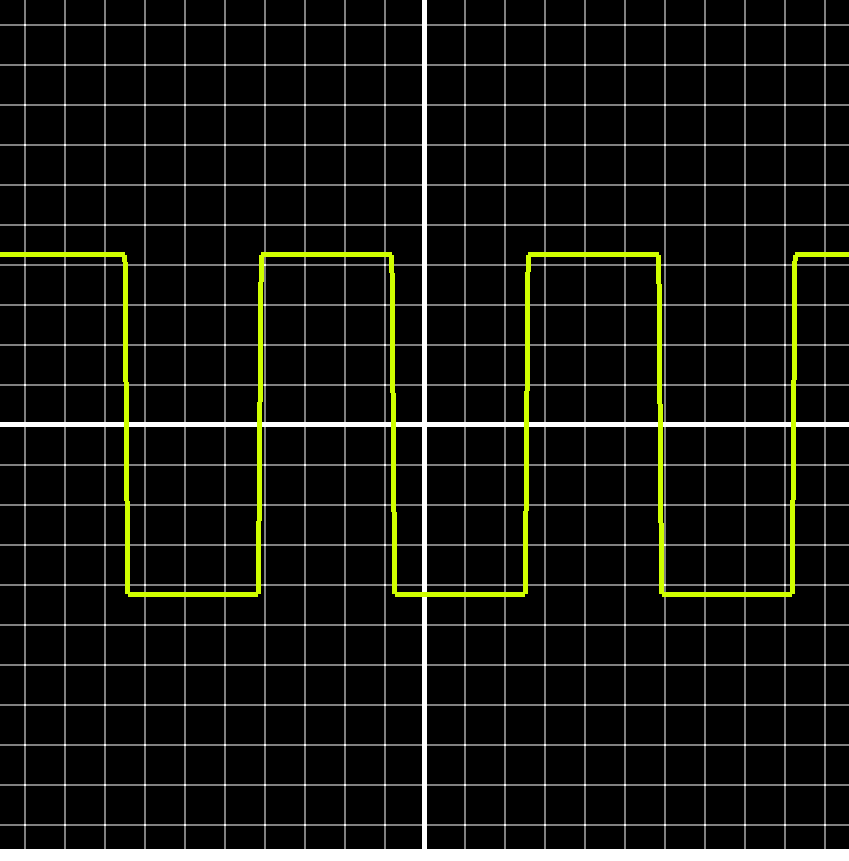 Square
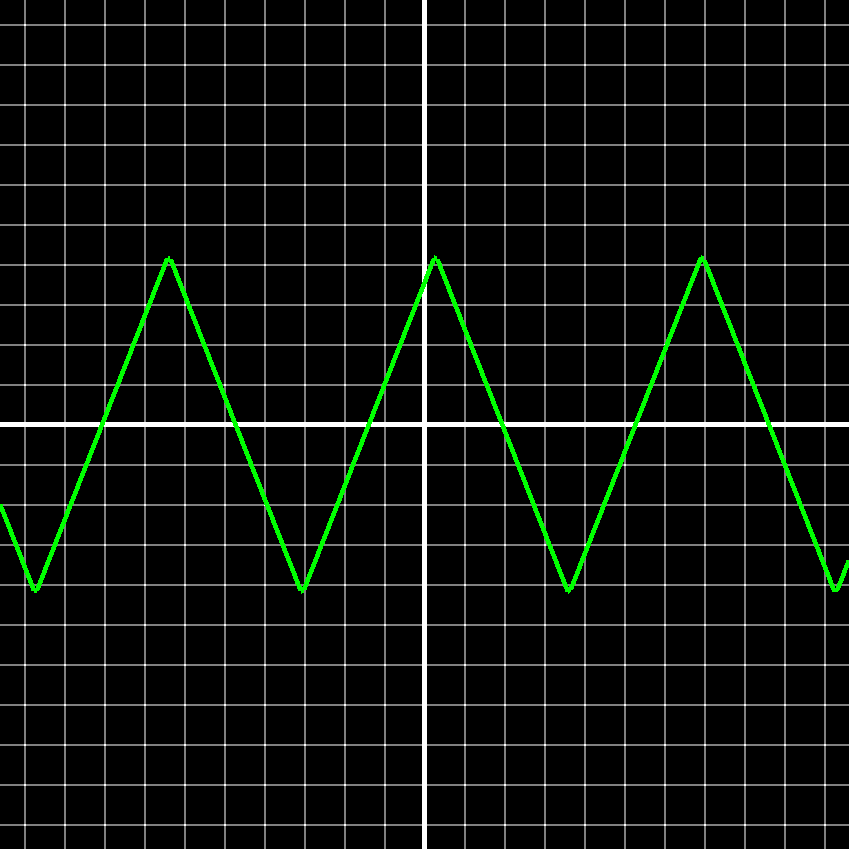 Triangle
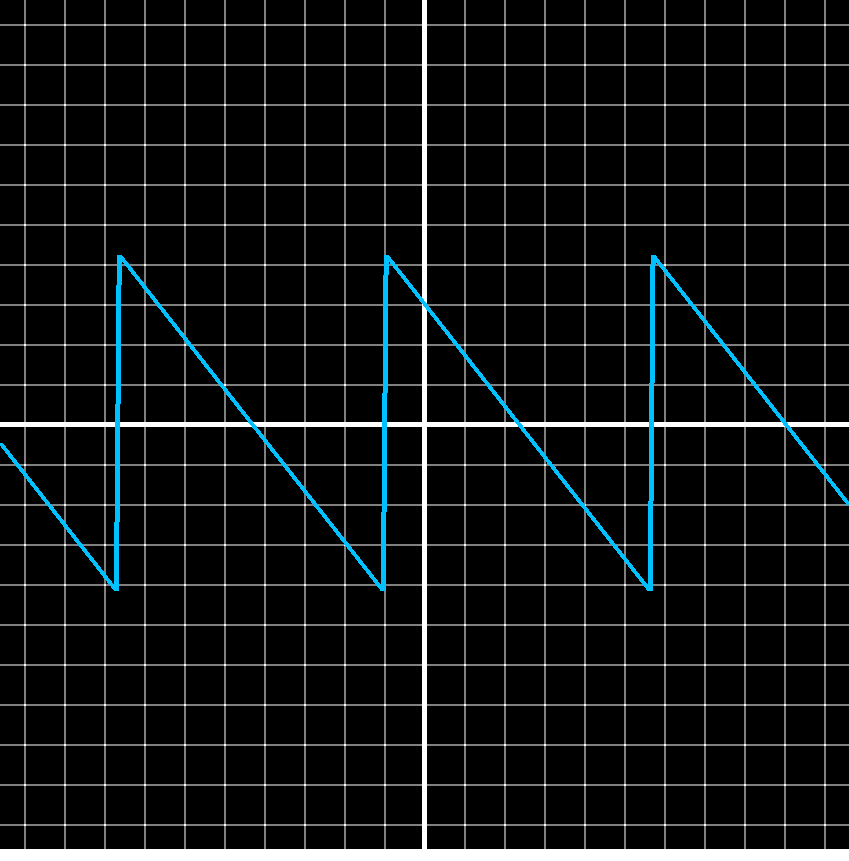 Sawtooth
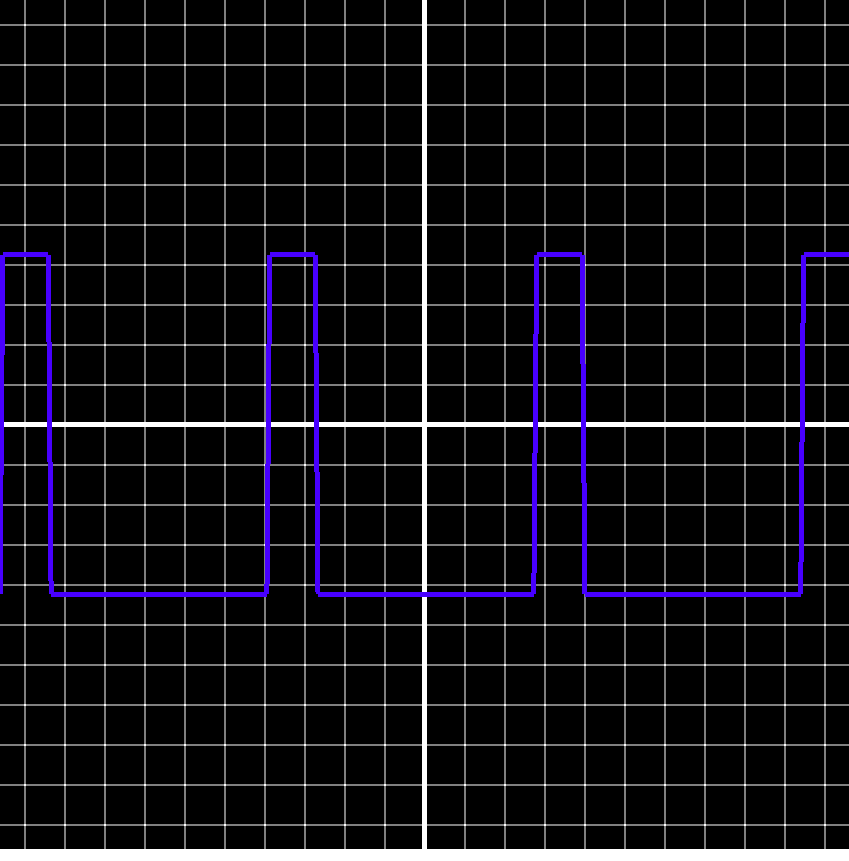 Pulse, with duty-cycle control
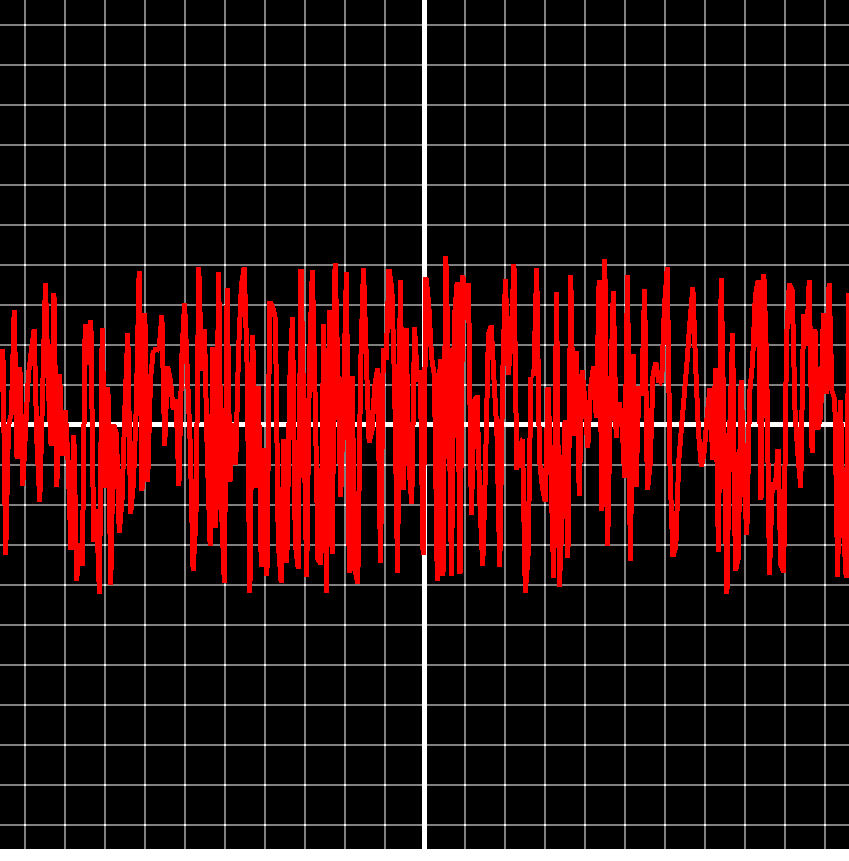 Noise
Noise
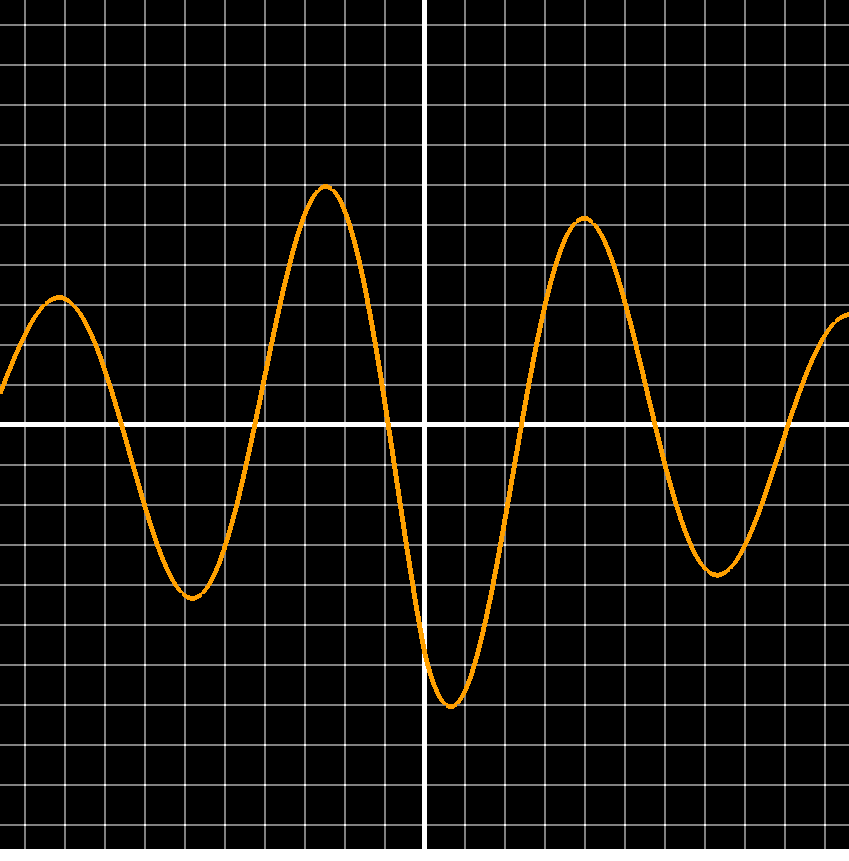 Exponential decay
Built on my framework
The whole thing runs on Lumina, my C++ application framework, which wraps OpenGL and an immediate-mode UI into a simple application shell. That's what keeps a tool like this small: the framework owns the window, the render loop, and the panels, so the project itself is almost entirely the waveform math and how it's drawn.
Where it's going
Frequency Visualizer is due for a major overhaul like the rest, so this is its current form, not the finished one.
Tech stack
| Layer | Technology | Role |
|---|---|---|
| Language | C++ | The waveform generation and rendering |
| Graphics | OpenGL | The real-time line rendering |
| UI | Dear ImGui | The parameter panels |
| Framework | Lumina, my C++ application framework | Windowing, the render loop, and the UI shell |
| Build | Visual Studio (Windows) | Where it compiles and runs |